Reports
The Reports section of a class is where you generate consolidated reports — both per-assignment and per-student — that summarise marking, snippets, and grade progression in a single document. Reports are designed for sharing with parents, heads of department, or for archival at the end of a term.
Where to Find Reports
- Open the Classes tab in the sidebar and click on Reports in the class sidebar. The page is divided into three areas:
- Assignment Reports — one report per assignment in the class
- Student Reports — one report per student in the class
- Submission Exports — bulk export of recent submissions
If your class has no assignments and no students yet, the page shows an empty state prompting you to add them first.
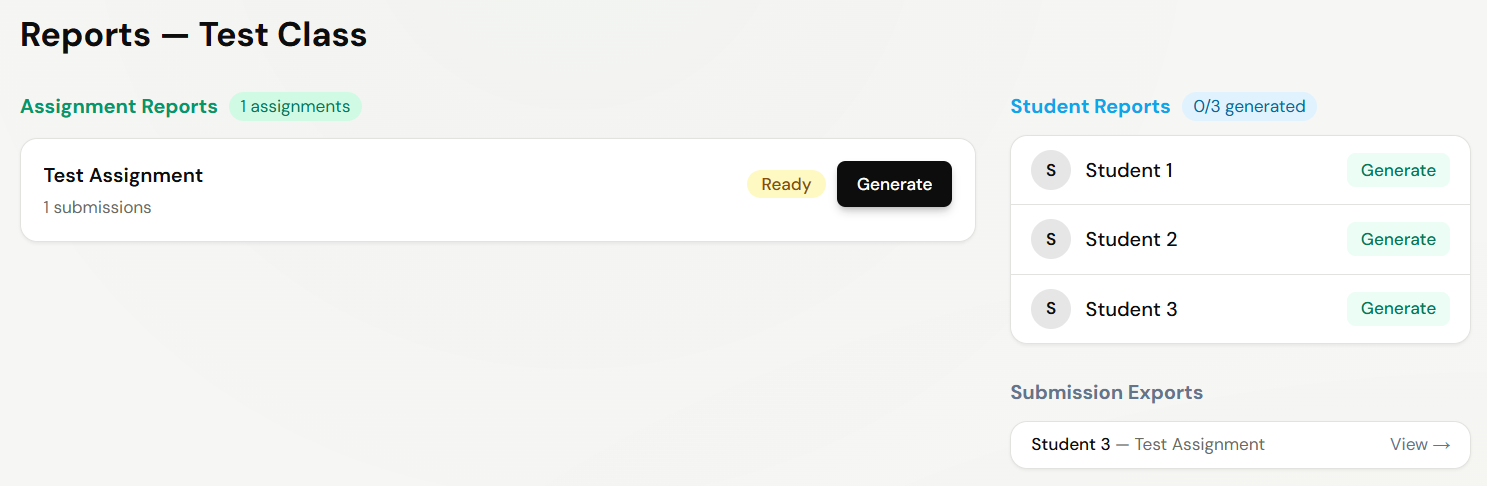
Generating an Assignment Report
An assignment report pulls together all the marking and feedback for a single assignment across the whole class — average scores, the snippet tags that came up most often, and overall trends.
- Find the assignment card in the Assignment Reports column
- Click
Generateon the card - ren. first checks that enough submissions have been marked. If not, you'll see a dialog explaining what's missing
- Once you confirm, the report is queued — the page refreshes every few seconds until it's ready
You can keep working in another tab while a report generates — the card updates on its own when it's done, or shows an error if something went wrong.
What's in the Report
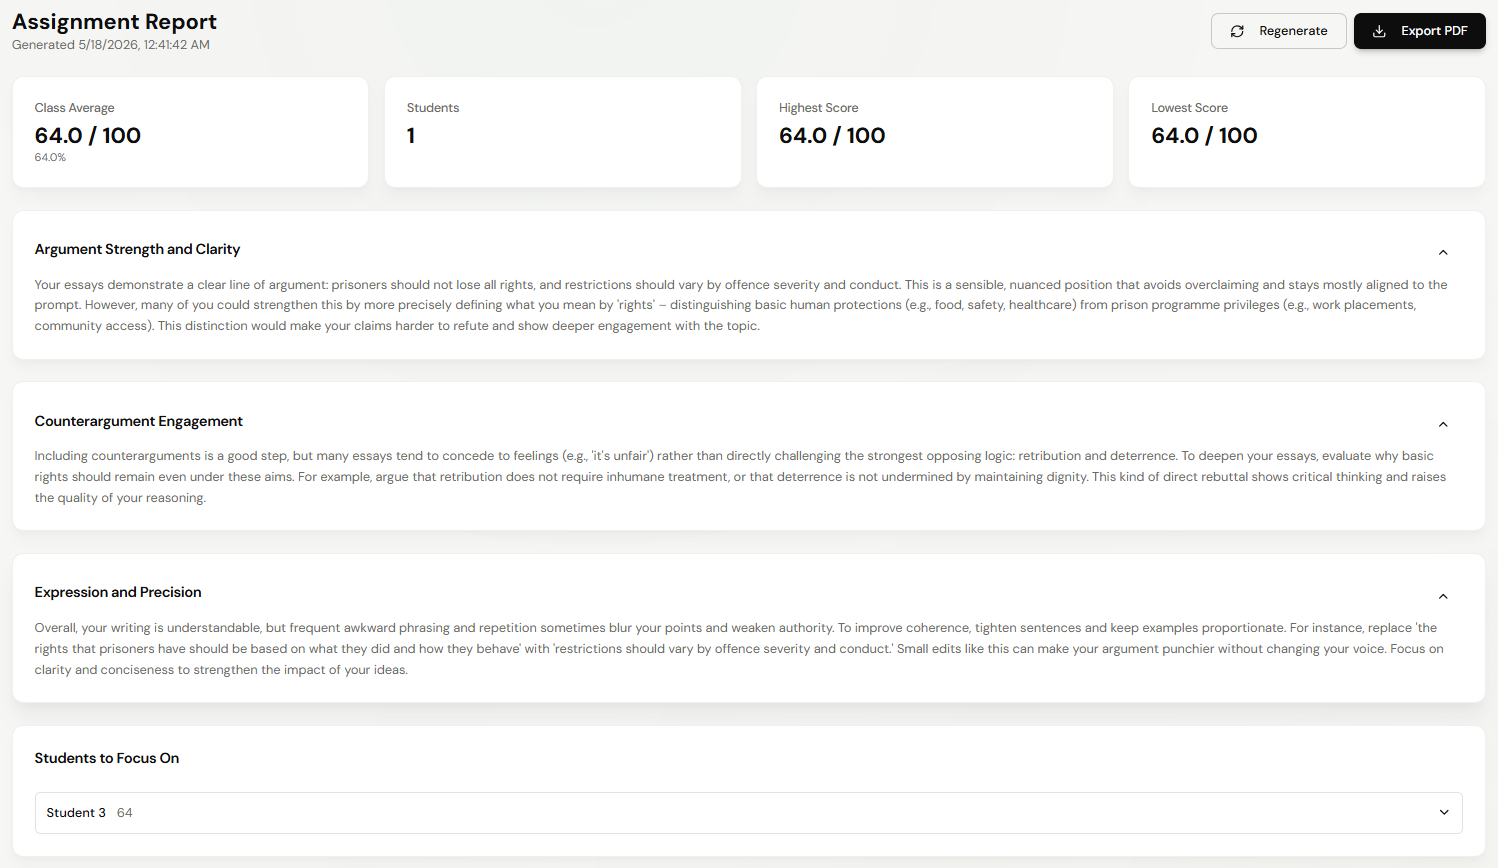
A generated assignment report combines AI-written narratives with class-wide analytics. The layout differs slightly between Essay and QnA assignments, but every report starts with:
- Summary cards — Class Average (raw score + %), total Students, Highest Score, and Lowest Score
- General Comments — an AI-written overview of how the class performed
Essay reports add:
- Content Analysis — narrative on the cohort's content quality
- Language & Style — narrative on writing quality
QnA reports add:
- Strengths & Weaknesses — a paired narrative covering what went well and what didn't
- Question Insights — per-question analysis
- The full QnA Analytics Dashboard (the same one shown inline on the assignment page) appended at the bottom
Both report types then close with:
- Students to Focus On — students whose work most needs attention
- Teaching Focus — concrete topics or skills to revisit with the class
Use Regenerate to rebuild the report after marking more work, or Export PDF for a clean printable version.
The Score Distribution and QnA Analytics panels at the bottom of an assignment page are a quick-look view of the same data. The Assignment Report is the fuller artifact — same charts plus AI-written narratives and recommended next steps for the class.
Generating a Student Report
A student report covers one student across all their assignments in the class — how their grades have progressed, the snippet tags that keep coming up, and a written summary of how they're doing.
- In the Student Reports column, find the student you want
- Click
Generate - As with assignment reports, ren. checks first that the student has enough marked work to report on
- Confirm to start. The page updates automatically as the report builds
What's in the Report
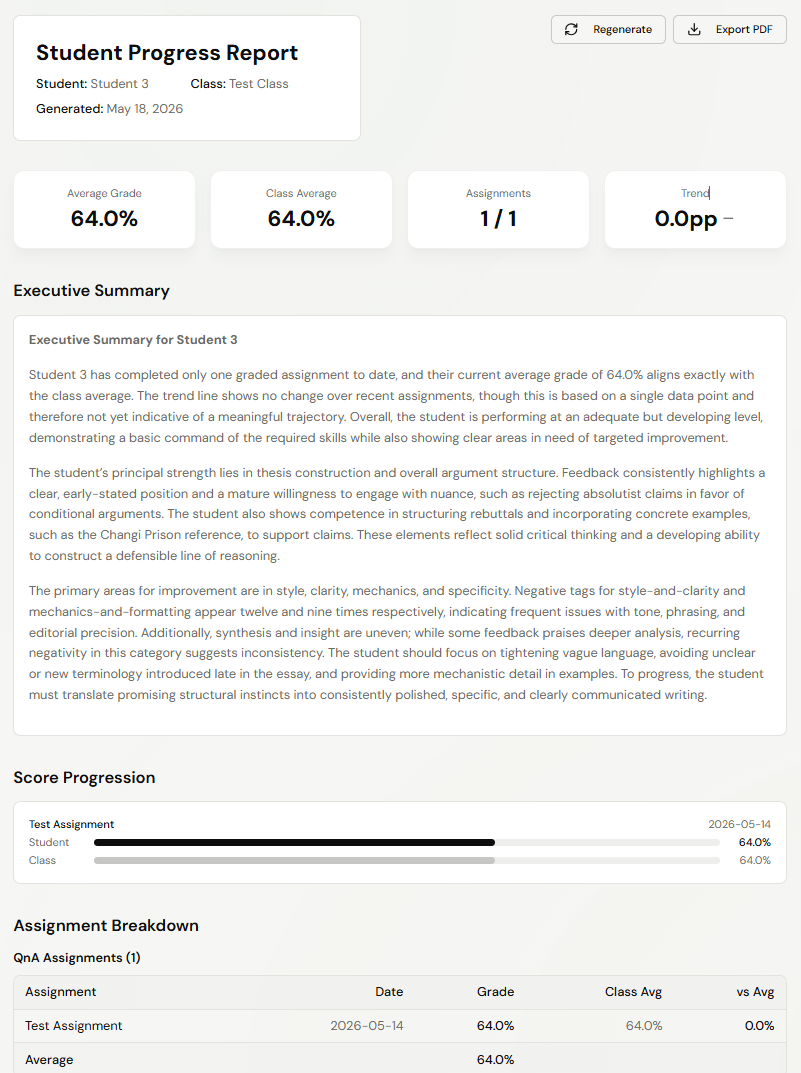
A generated student report is laid out top to bottom as follows:
- At a Glance — four headline stats: Average Grade, Class Average, Assignments (completed / total), and Trend (change in percentage points with an up/down/flat indicator)
- Executive Summary — an AI-written narrative summarising the student's overall performance
- Score Progression — a chart tracking the student's grades over time against the class average
- Assignment Breakdown — a table of every assignment with date, grade, class average, and component scores
- Tag Analysis — tables of the feedback tags that appear most often in the student's work, broken down by polarity (positive / negative / neutral)
- Strengths — AI-identified strengths from across the student's submissions, each with supporting detail
- Areas for Improvement — AI-identified weaknesses with supporting detail
- Actionables — concrete next steps the student can take
- One More Thing... — an optional closing note when the AI has something else worth flagging
The two buttons at the top right let you Regenerate the report (useful if you've marked more work since the last build) or Export PDF for a clean printable version to share with the student or HOD.
Exporting Submissions
The Submission Exports panel shows how many marked submissions the class has and lets you download them in bulk. Use it when you want the raw submission files outside of ren. — for example, to upload them to your school's system.
Tips for Reports
- Reports only include marking you've already finalised — they don't run fresh AI marking. Finish marking the assignments you care about before generating
- If a report fails, click
Generateagain to try once more - Reports that take a while can be left running in a background tab — ren. updates the card on its own when it's ready
Relevant Guides
- AssignmentsReports use marked submissions as their source
- StudentsPer-student profile view