Read the class report for an assignment
A class report sums up one assignment across the whole class: how the class did, where marks were lost, and which students need the most help. Use it to plan lessons or share with your Head of Department (HOD).
Before you start
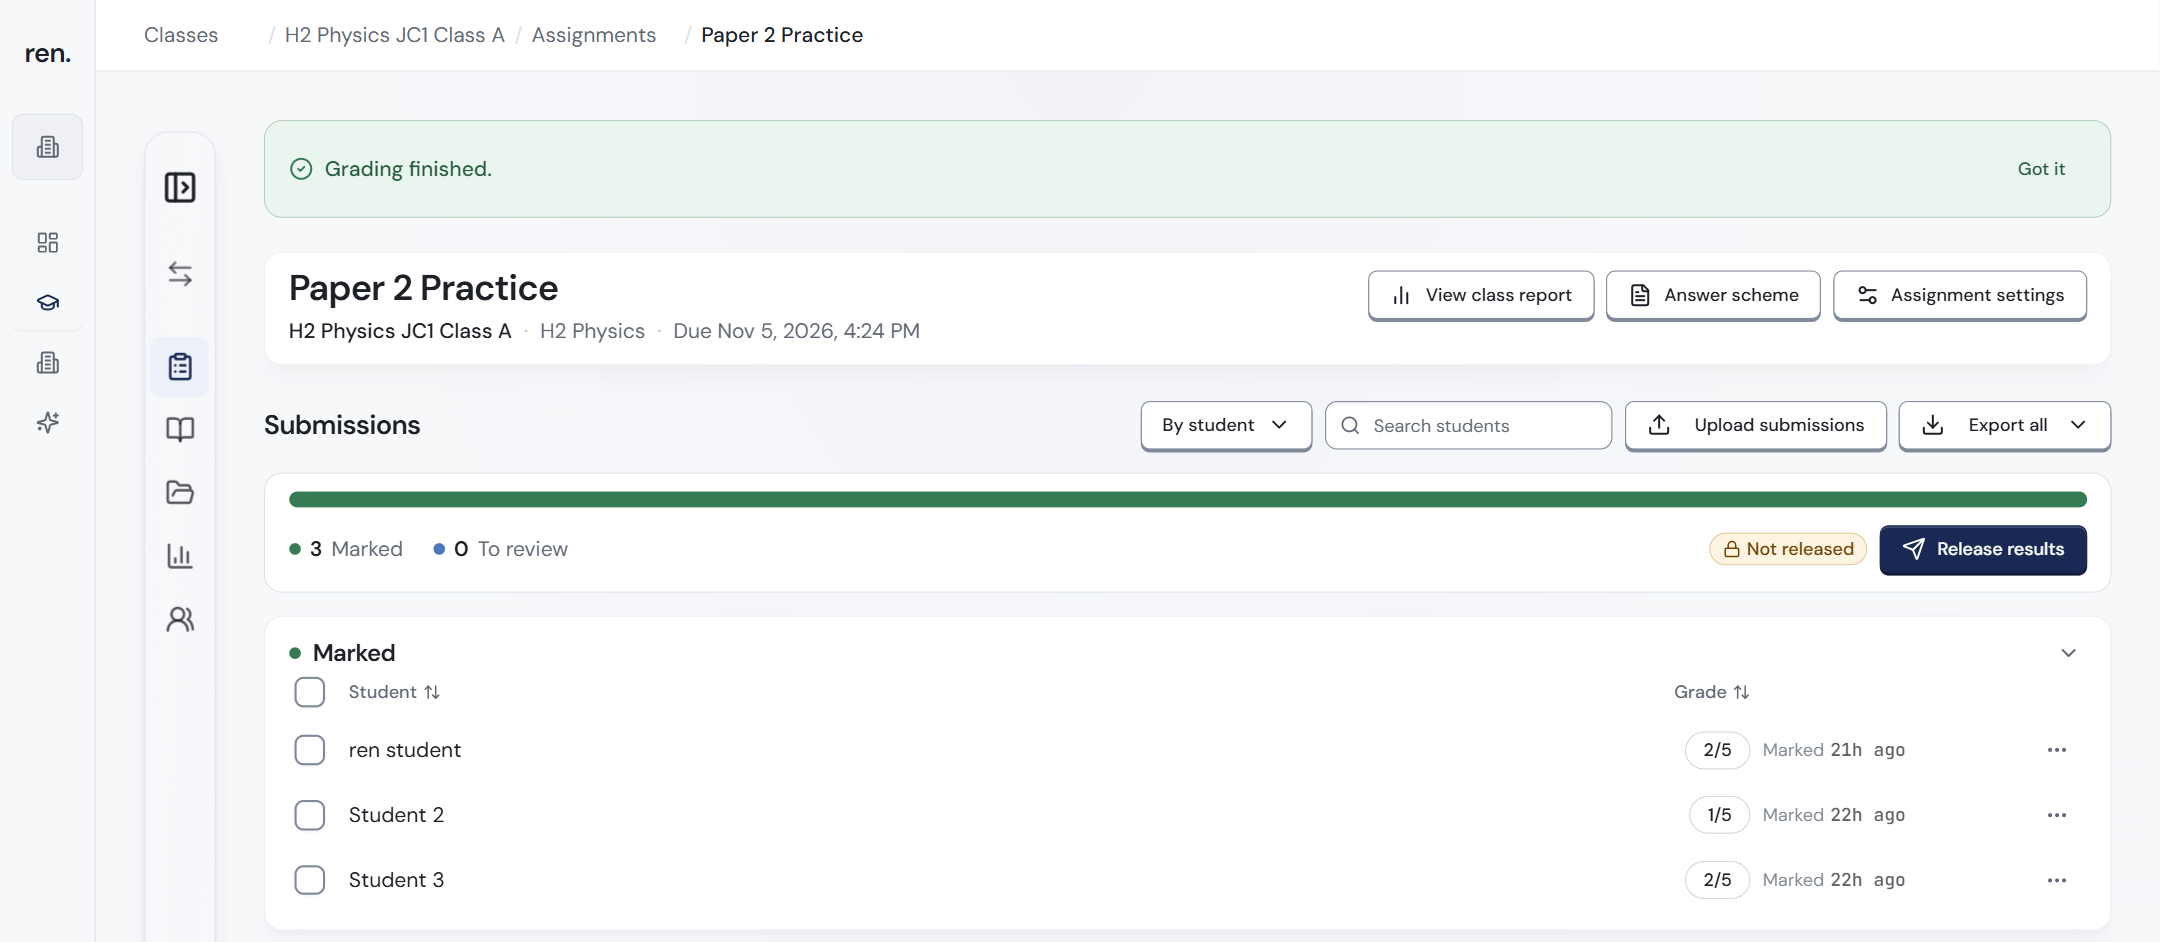
- Mark every script as complete. The report only uses finished scripts and does not run any new AI marking.
- You do not need to release results first. The Build class report button appears once at least one script is marked complete. Students do not see the report.
Build the report
- Open the class and click Assignments, then open the assignment.
- Click Build class report at the top, next to Answer scheme (your marking scheme) and Assignment settings.
- If some scripts are not finished, a box warns Not all submissions are marked; class averages will be off without them. Click Cancel and finish them first, or click Generate anyway for a rough view.
- Wait while it says Building report…. The report opens when it is ready.
Next time, the button says View class report.
Build it from the Reports page instead
You can also use the Reports page of the class. On the assignment's card:
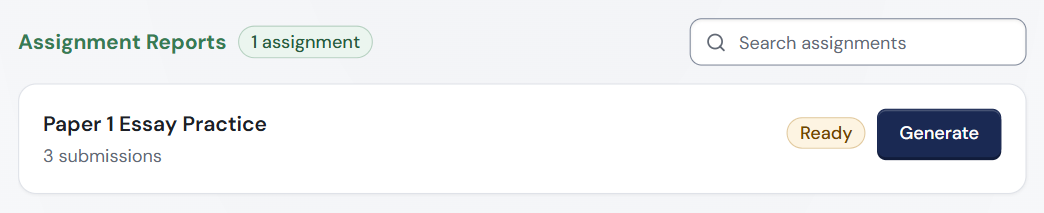
- Not ready: no scripts are marked complete yet.
- Ready: click Generate to build the report.
- Completed: click View Report to open it.
- Failed: click Try again. Or click Build class report again on the assignment page.
What the report tells you
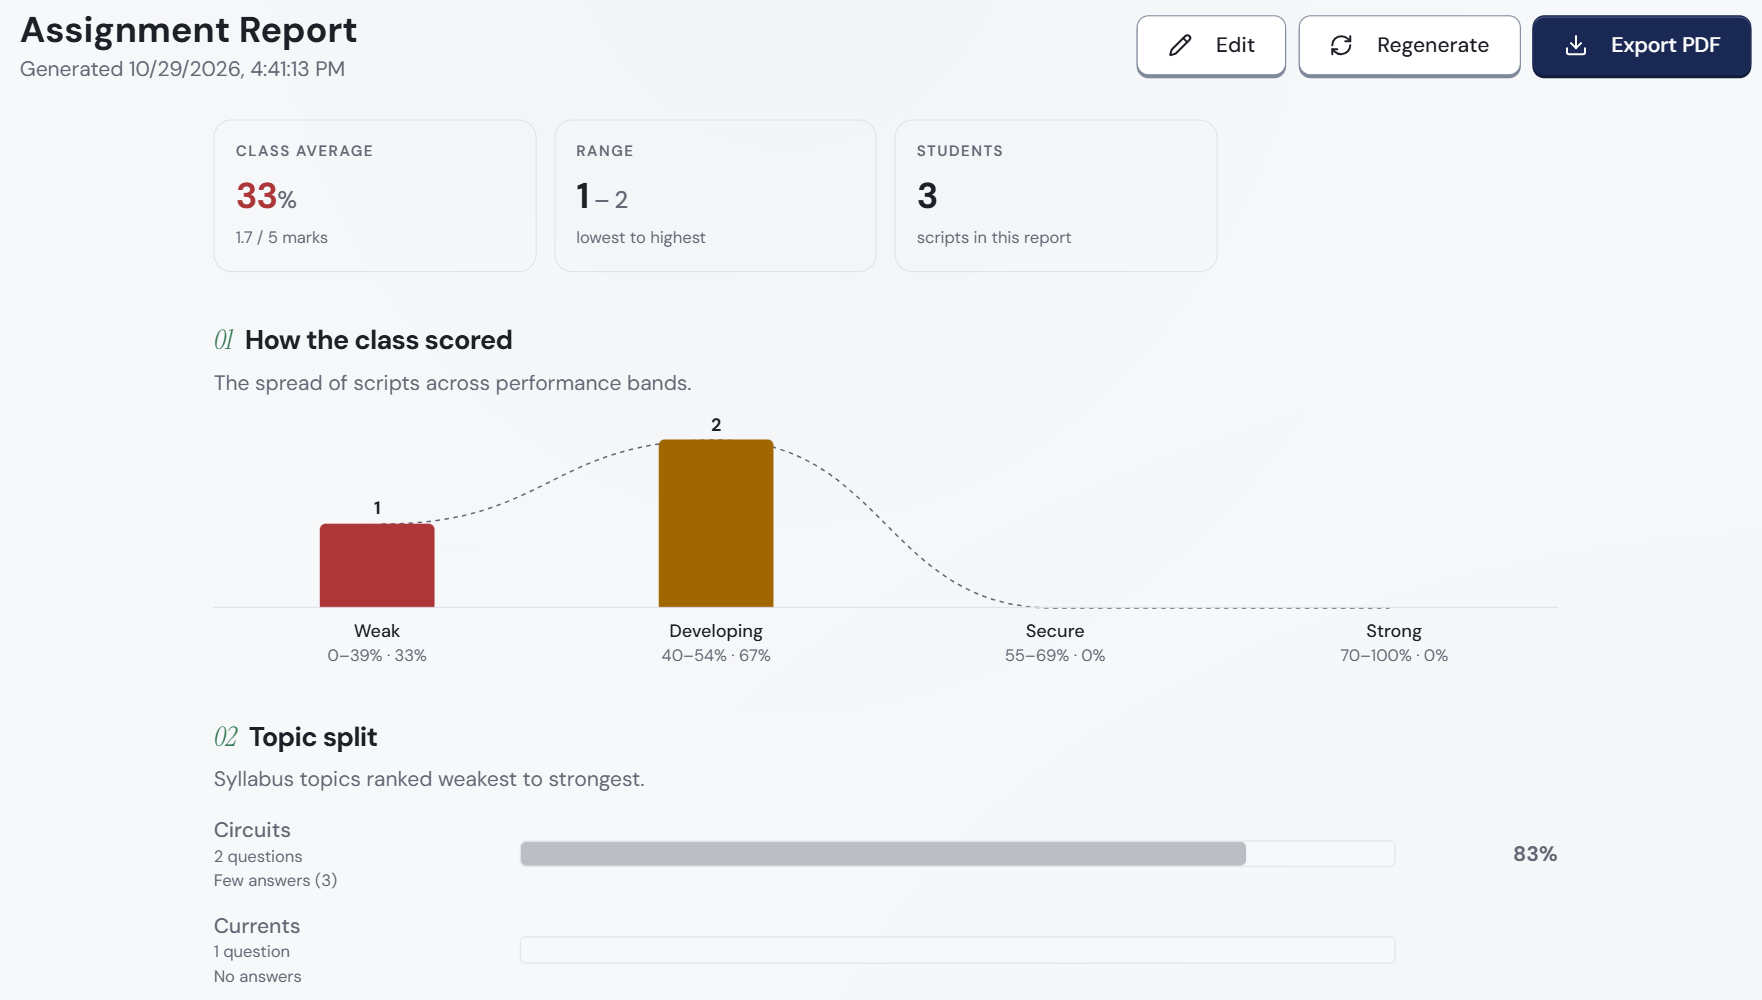
The top of the report says Assignment Report and when it was generated, then three summary boxes:
- Class Average: the average score as a percentage, with the marks underneath (for example 33%, 1.7 / 5 marks).
- Range: the lowest to highest score, in marks (for example 1 - 2). A wide range means students are far apart.
- Students: how many scripts are in this report. Check this matches your class.
The bands
ren. colours scores by band (score group). The How the class scored chart uses four bands:
| Band | Score |
|---|---|
| Weak | 0% to 39% |
| Developing | 40% to 54% |
| Secure | 55% to 69% |
| Strong | 70% to 100% |
The student progress report uses three bands: Weak (under 40%), Developing (40% to 54%) and Secure (55% and above).
The sections
The big picture:
- 01 How the class scored: how many scripts fall in each band, and their share of the class (for example Developing 40-54% · 67%). It shows whether most students are secure or many are struggling.
- 02 Topic split: the syllabus topics, ranked weakest to strongest. Each topic shows how many questions cover it and the class score as a bar. A topic only a few students answered is greyed out and labelled Few answers with the number of answers, for example Few answers (3); do not read too much into it. A topic nobody answered says No answers.
- Analysis: the problems that came up most often in script comments. Use it to decide what to cover next.
Then:
- Question performance: the class average on each question, lowest first. It shows what to reteach.
- Students to focus on: the lowest-scoring scripts, each with a link to open the marked script.
Edit, update or share the report
Use the buttons at the top right:
- Edit: change the wording before you share it.
- Regenerate: build the report again after you change marks. It does not update by itself; it may remind you with Marks changed after this report was made.
- Export PDF: download a printable copy for your records or your HOD.