Read a student's progress report
A student progress report sums up one student's work across every marked paper in your class: their overall score, how they compare with the class, and what to work on next. Use it before a parent meeting or a one-to-one talk.
Before you start
- Mark the student's scripts as complete. The report only uses finished scripts. Making a report does not show anything to students.
Find the Reports page
- Open the class.
- Click Reports in the class menu on the left.
The page lists all your reports for this class.
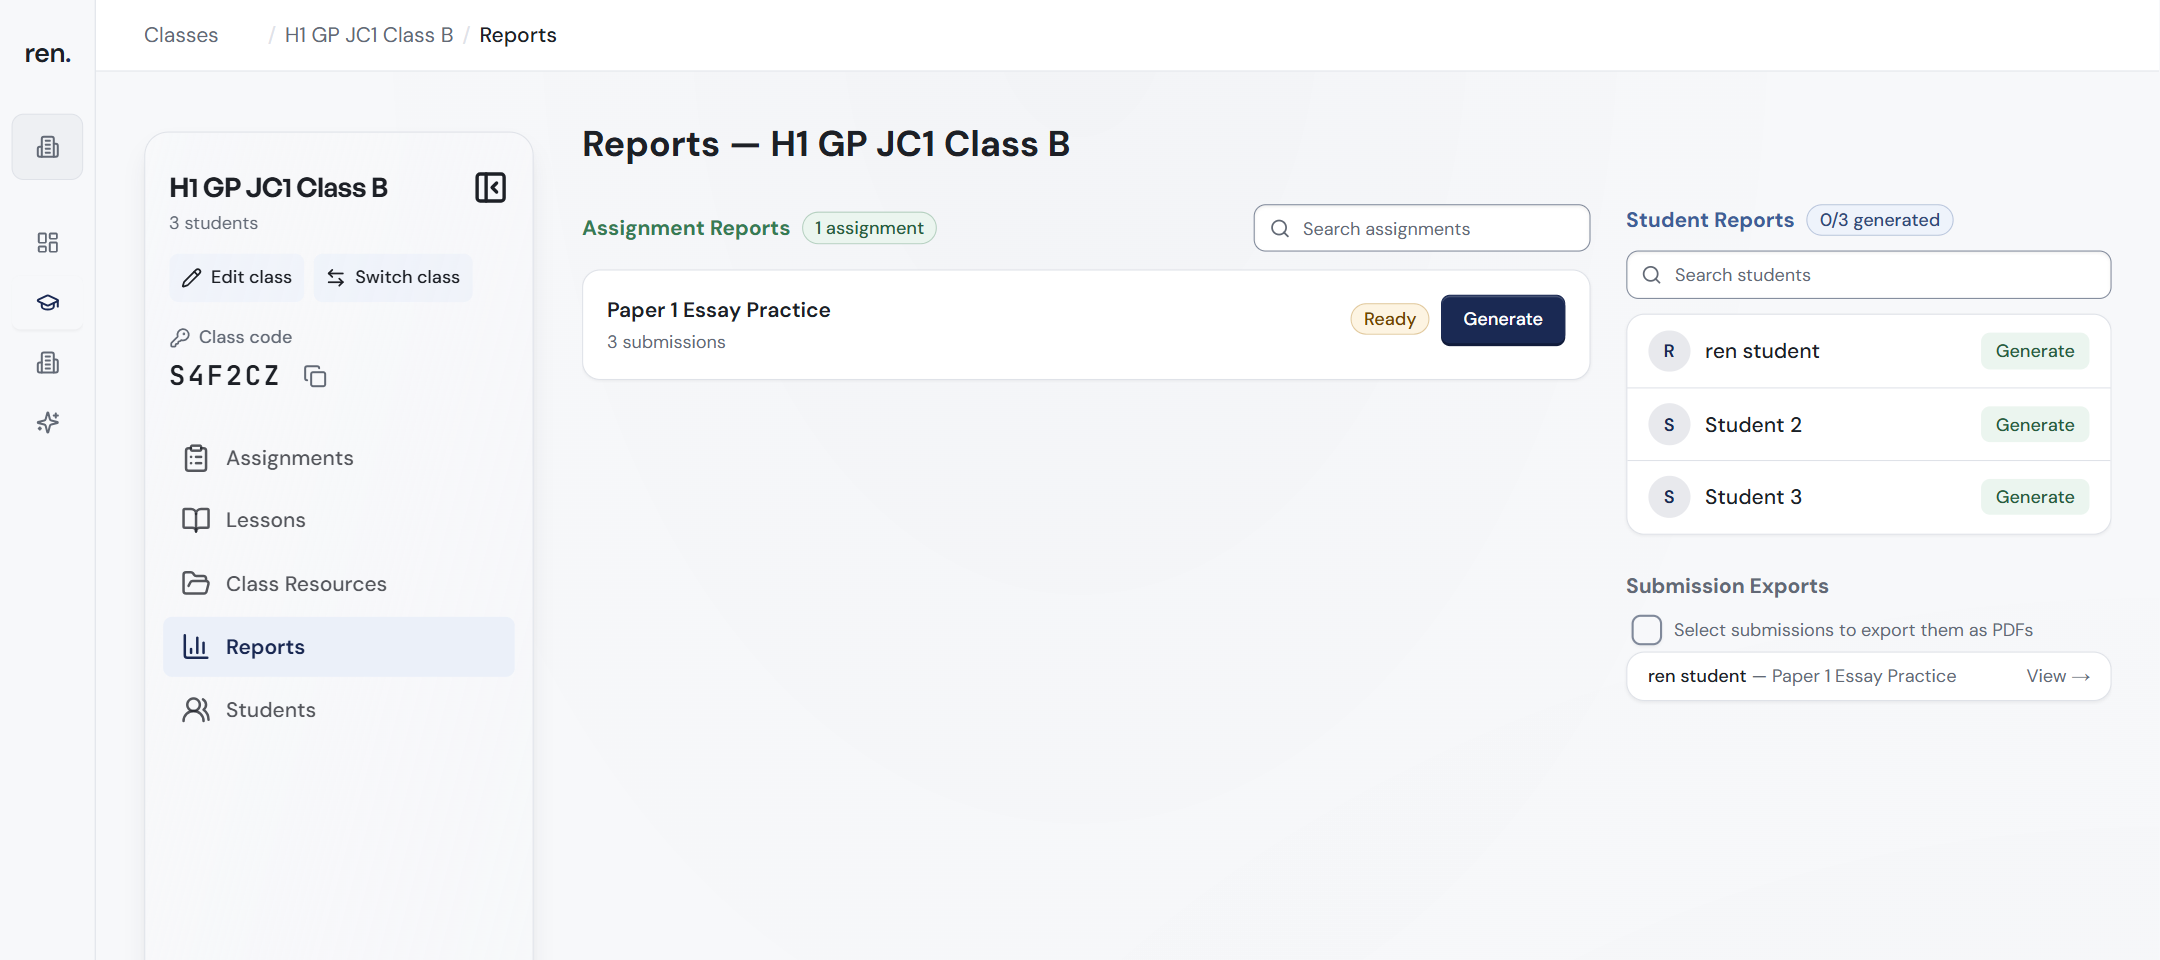
- Assignment Reports (left): one card per assignment, with the number of scripts and the date the report was made. Not ready means none of its scripts are marked complete yet. Ready means you can click Generate to build it. Completed means you can click View Report. See Read the class report for an assignment.
- Student Reports (right): one row per student. The badge at the top, for example 1/3 generated, shows how many students have a report.
- Submission Exports (bottom right): download marked scripts as PDFs. Tick the scripts you want, or click View → to open one.
Make a student's report
- In Student Reports, find the student. Use Search students if the class is large.
- Click Generate. The row says Generating... while ren. builds the report from the student's marked papers.
- When it is ready, click View Report → on the row.
You can also open it from the class Students page: click View Report on the student's row.
If a report fails, the row shows Try again; click it. After you change any marks, click the round arrow icon next to View Report → (it says Regenerate report when you point at it). This builds the report again so it is up to date.
What the report tells you
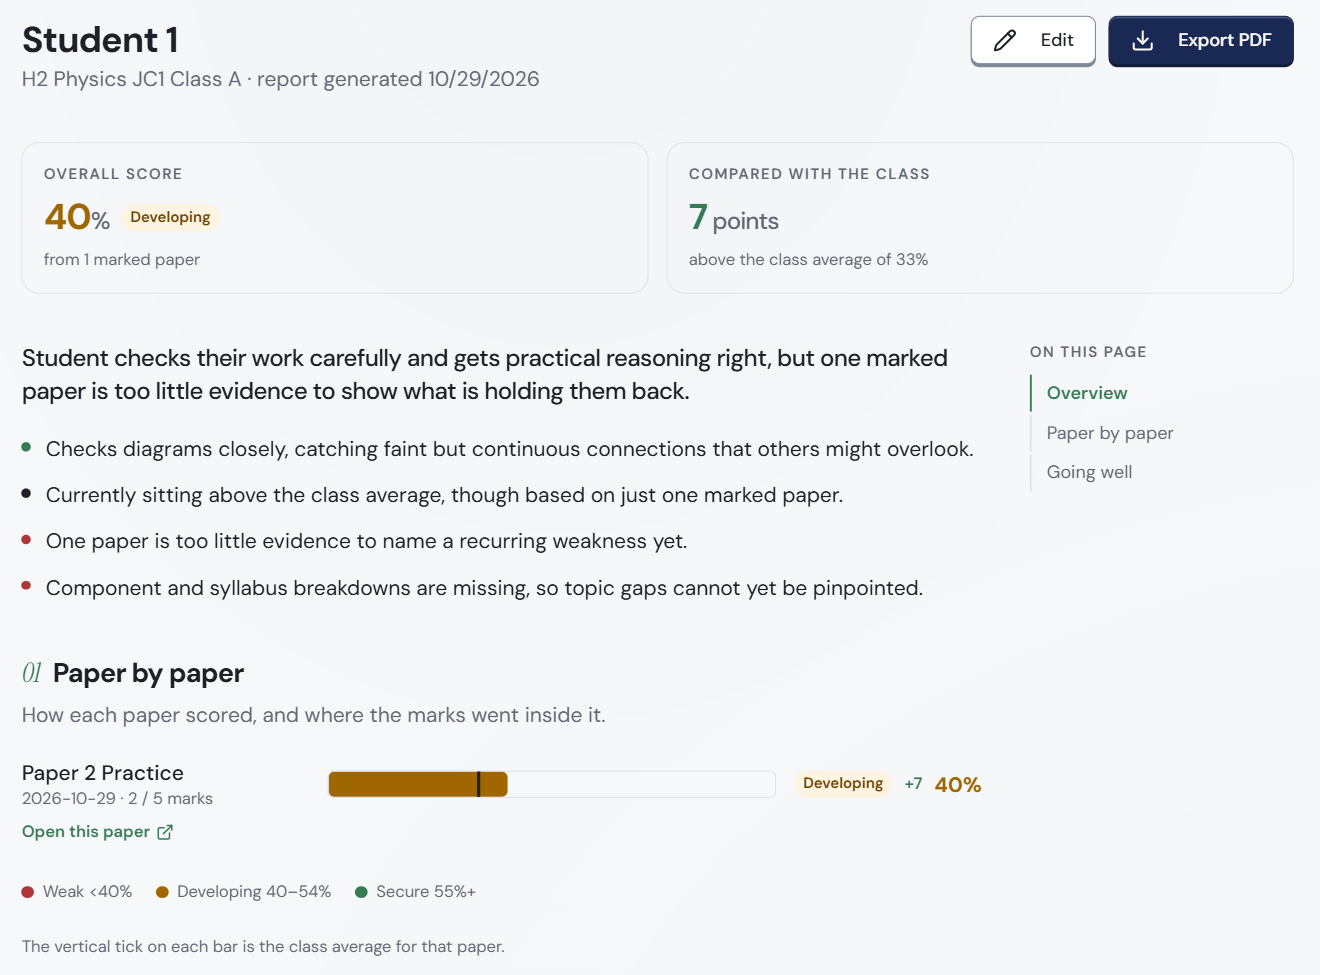
The top shows the student's name, the class and the date the report was generated.
- Overall score: the student's average as a percentage, with its band (score group). For example 40% Developing. It also says how many marked papers it is based on (for example from 1 marked paper); one paper tells you much less than five.
- Compared with the class: how many points above or below the class average the student is, for example 7 points above the class average of 33%.
- Overview: a short summary of the student's strengths and gaps, with a few bullet points.
- 01 Paper by paper: how each paper scored. Each marked paper shows its date, marks, band, how far above or below the class it is (for example +7) and its score. The bar shows the student's score; the vertical tick on it is the class average for that paper. Click Open this paper to see the marked script.
- Going well: the student's strengths, backed by comments on their own scripts.
- Holding them back and What markers keep writing: the student's weak spots and repeated problems, quoted from comments on their own scripts.
- What to work on next and One more thing: suggested next steps for the student.
The bands are Weak (under 40%), Developing (40% to 54%) and Secure (55% and above), shown in the legend under Paper by paper. (Only the How the class scored chart in the class report splits off a fourth band, Strong; see the bands.)
Use the On this page list on the right (for example Overview, Paper by paper, Going well) to jump between sections.
Share the report
- Click Edit at the top right to change the wording.
- Click Export PDF to download a clean, printable copy for the student, parents or your Head of Department (HOD).
Reports are built from the comments on marked scripts, so clear, specific comments give a more useful report.